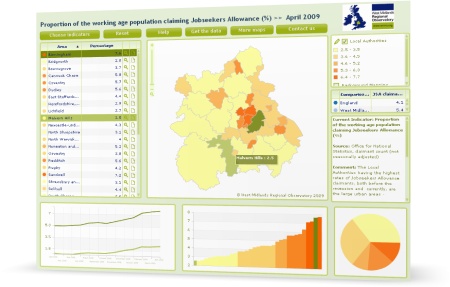
An interactive map produced by the Observatory has been featured in The Guardian’s top 10 government data visualisations and applications.
This map shows the proportion of the working age population claiming Jobseeker’s Allowance in each local authority in the West Midlands. You can also compare data for each local authority with the West Midlands and UK averages.
The map is based on the latest employment and unemployment data released monthly by the Office for National Statistics. The Observatory analyses this data as part of its work in monitoring the impact of the recession on the West Midlands.
As well as local authority, we also show the data in maps for:
The 10 data visualisations and applications were highlighted by the Guardian Datastore on the same day the government publicly launched the data.gov.uk site. This new site aims to unlock innovation and encourage data-led decisions by opening up public sector data for reuse in innovative applications and websites.
Filed under: Data, Employment, Geographical Information, Maps, Regional Data and Intelligence Network, West Midlands, West Midlands Regional Observatory, wmro.org | Tagged: data visualisation, datastore, datastories, Geographical information, guardian, InstantAtlas, mapping, unemployment, wmrosid | 6 Comments »


